Archive for the 'research' Category

Mar
3

I love a good reading list and have found ones posted online so helpful in building my own (for example, the Critical Algorithm Studies list), so I thought I’d share a couple. First is a recent list I made for the open access journal Places and the remaining three are from my PhD qualifying exams. Happy reading!

01

print by Ann Altstatt

1) Cloud Vision, reading list for Places Journal

How can we understand the vast assemblages of networked computers that have come to subtend almost every aspect of political, social, and cultural life? Constantly at work on massive scales and at the speed of light, exceeding our ability to make sense of them, they construct the world in unpredictable and surprising ways. Hidden behind metaphors like ‘the cloud,’ fragments of these networks sometimes come into view. Geographies of wires, cables, data centers, servers, satellites, and other material things that make computing possible dot the landscape, if one knows where to look. Sometimes these networks become visible upon breakdown, as hacked appliances take down whole sections of the internet or as computational models fail spectacularly to predict human action and desires. And they are constantly producing new ways of seeing and acting in the world by making particular patterns, processes, and inferences visible to users. The cloud, then, poses unique theoretical and methodological challenges for scholars attempting to make sense of these emerging geographies. The reading list that follows offers a number of cuts on this problem from scholars in a range of disciplines, all with their heads in the cloud.

SEE THE LIST ON PLACESJOURNAL.ORG

2) Qualifying exams reading lists

LIST 1: SCIENCE ←→ SOCIAL THEORY

LIST 2: SPATIAL THEORY IN HUMAN GEOGRAPHY

LIST 3: DIGITAL STUDIES: STRUCTURING EFFECTS


Continue reading »

Dec
12

In his book Speed and Politics first published in 1977, the french philosopher Paul Virilio writes of an early computer-aided predictive policing system being tested in France in this fascinating footnote (170-171):

virilioPolicing

Dec
1

cocitations2

In an attempt to trace a history of radical thought within the discipline of geography (and assemble a reading list for my qualifying exams), I’ve been experimenting with co-citation visualizations. These network graphs rely on citation data from Web of Science, connecting texts that are cited together a minimum number of times, as indicated by the citation threshold slider. I focused mostly on the journal Antipode, which has offered a “radical (Marxist/socialist/anarchist/anti-racist/feminist/queer/green) analysis of geographical issues” since its founding in 1969. Unfortunately, Web of Science only indexes Antipode articles from 1990 through 2015. But I was able to see how older Antipode articles have been taken up by three major English language geography journals (The Annals of the Association of American Geographers, Progress in Human Geography, and Transactions of the Institute of British Geographers) by mapping co-citations of Antipode articles within them. This allowed me to go back to 1969 for the Annals, 1982 for Progress, and 1970 for Transactions and produce this graph:

cocitations3

Zooming in reveals discussions within the discipline. For example on the left, we find five scholars debating visuality within geography in a special issue in Antipode, while on the right, we find an ongoing discussion about the university, education, and pedagogy:

cocitations

Below are all of the graphs I’ve done so far. Let me know if you find any interesting patterns!

Co-Citations of Antipode Articles in the Annals (top 1500 cited articles 1969-2015), Progress (top 1000 cited articles 1982-2015), and Transactions (top 1000 cited articles 1970-2015)

Co-Citations, All Antipode Articles, 1990-2015

Co-Citations in the 50 Most Cited Articles, Antipode, 1990-2015

Co-Citations of Antipode Articles in Antipode, 1990-2015

Co-Citations in the Annals (top 1500 cited articles 1969-2015), Progress (top 1000 cited articles 1982-2015), and Transaction (top 1000 cited articles 1970-2015)

This work relies on code written by number of people. I used Neal Caren’s python script with slight modifications to convert the Web of Science data into a D3 graph. Kieran Healy’s code helped me modify the visualization. And Jonathan Goodwin’s code and write-up were super helpful in adding the citation threshold slider and putting everything together.

Oct
27

hitachi viz suite

screenshot from video demo: https://www.youtube.com/watch?v=Xz_P9CXYpmA

Hitachi Data Systems, in a recent announcement, has upped the ante in the predictive policing game with the introduction of Visualization Predictive Crime Analytics (PCA) into their Visualization Suite. They claim:

PCA is the first tool of its kind to use real-time social media and Internet data feeds together with unique, sophisticated analytics to gather intelligent insight and enhance public safety through the delivery of highly accurate crime predictions.

The press release explicitly connects the technology to “smart cities,” claiming the suite will “help public and private entities accelerate extraction of rich, actionable insights from all of their data sources.” The use of the word “actionable” here is interesting and reminds me of Louise Amoore’s great article, “Data Derivatives: On the Emergence of a Security Risk Calculus for Our Times” from 2011. The data derivative, in Amoore’s articles, is the “flag, map or score” that is inferred from large data sets like those used in Hitachi’s PCA system. She argues:

The pre-emptive deployment of a data derivative does not seek to predict the future, as in systems of pattern recognition that track forward from past data, for example, because it is precisely indifferent to whether a particular event occurs or not. What matters instead is the capacity to act in the face of uncertainty, to render data actionable.

The whole project seems wildly ambitious, with unknown statistical models, machine learning algorithms, and natural language processing routines holding it all together. More from the press release:

Hitachi Visualization Suite (HVS) is a hybrid cloud-based platform that integrates disparate data and video assets from public safety systems—911 computer-aided dispatch, license plate readers, gunshot sensors, and so on—in real time and presents them geospatially. HVS provides law enforcement with critical insight to improve intelligence, enhance investigative capabilities and increase operational efficiencies. Along with capturing real-time event data from sensors, HVS now offers the ability to provide geospatial visualizations for historical crime data in several forms, including heat maps. This feature is available in the Hitachi Visualization Predictive Crime Analytics (PCA) add-on module of the new Hitachi Visualization Suite 4.5 software release.

Blending real-time event data captured from public safety systems and sensors with historical and contextual crime data from record management systems, social media and other sources, PCA’s powerful spatial and temporal prediction algorithms help law enforcement and first responder teams assign threat levels for every city block. The algorithms can also be used to create threat level predictions to accurately forecast where crimes are likely to occur or additional resources are likely to be needed. PCA is unique in that it provides users with a better understanding of the underlying risk factors that generate or mitigate crime. It is the first predictive policing tool that uses natural language processing for topic intensity modeling using social media networks together with other public and private data feeds in real time to deliver highly accurate crime predictions.

hitachi infographic

from: https://www.hds.com/assets/pdf/hitachi-social-innovation-and-visualization-solutions-infographic.pdf

Oct
5

PH97214-b

PredPol software used in Santa Cruz, CA

Recently, I’ve been writing about software used in surveillance and policing practices. One such practice, called predictive policing, uses software packages to analyze spatial crime data and predict where and when future crimes are likely to happen. Police departments can then use this information to decide where to deploy officers. This practice has received some mainstream press in recent years, with many pointing out its similarities with the Pre-crime division in the 2002 film Minority Report. Coincidently, the last three cities I’ve called home–Santa Cruz, Oakland, and Madison–have all used predictive policing software.

One popular package, PredPol, use principles from earthquake aftershock modeling software. Others are sometimes compared to analytic software used to create targeted ads through the analysis of customer shopping data. Of course, these software packages are proprietary, making it difficult to look under the hood to see how they really work. But their use of existing crime data should be a cause for alarm, especially in places with disparities in policing.

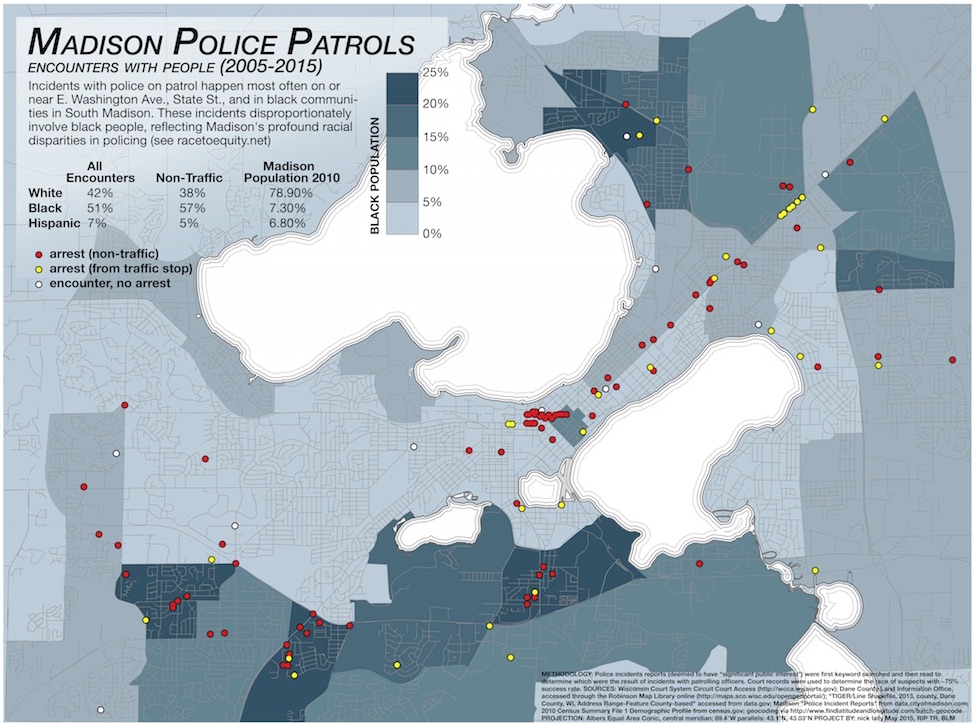
A news article from the Wisconsin State journal last year indicates that crime analysts in Madison are using predictive policing software, although the details are vague and there isn’t much documentation that I could dig up. But in a city with well-documented and profound racial disparities in policing, we can only guess that this will reinforce those practices.

As Ingrid Burrington writes in a Nation article:

All of these applications assume the credibility of the underlying crime data—and the policing methods that generate that data in the first place. As countless scandals over quotas in police departments demonstrate, that is a huge assumption.

She observes:

It’s easy to imagine how biased data could render the criminal-justice system even more of a black box for due process, replacing racist cops with racist algorithms.

The adoption of software solutions for policing, whether implicitly or explicitly, often contain the hope of bypassing the problem of structural racism in policing. But these software packages can only reinforce those racist assumptions if they rely on datasets constructed through policing practices. Madison Police Chief Koval rejects claims that his department is responsible for racial disparities in policing, deferring blame onto the larger community:

“On any given month, more than 98 percent of our calls for service are activated through the 9-1-1 Center,” he said in a statement. “Upon arrival, our officers are required by law to evaluate the behavior that is manifesting to see if it reaches legal thresholds required to ticket and/or arrest.”

But, as I argued in an earlier post, the practices of patrolling officers seem to reflect those same disparities (although, the role of community members in perpetuating racism should also be taken seriously). This can only lead to a situation where the algorithms merely reflect and hone actually existing ideas and spatial imaginaries about who commits crimes and where. And I don’t doubt that these systems will produce arrest statistics to back up their claims, but whose interests are they serving?

As Ellen Huet observes in Forbes:

Police departments pay around $10,000 to $150,000 a year to gain access to these red boxes, having heard that other departments that do so have seen double-digit drops in crime. It’s impossible to know if PredPol prevents crime, since crime rates fluctuate, or to know the details of the software’s black-box algorithm, but budget-strapped police chiefs don’t care. Santa Cruz saw burglaries drop by 11% and robberies by 27% in the first year of using the software. “I’m not really concerned about the formulas,” said Atlanta Police Chief George Turner, who implemented the software in July 2013. “That’s not my business. My business is to fight crime in my city.”

I think it’s time to be concerned.

Aug
24

Madison, WI is home to some of the worst racial disparities in policing, incarceration, education, poverty, and employment in the country (see the Race to Equity report or the Wisconsin State Journal summary). In the last year, paralleling the emergence of the Black Lives Matter movement, groups like the Young Gifted and Black Coalition (YBG) have organized to address these disparities through direct action, training, coalition building, and education. One of their demands is for the Dane County Jail to release 350 Black prisoners to reflect the demographics of the county, where Black people make up 6% of the county population and nearly 50% of the jail population.

In an open letter to the Madison Police Chief, YGB recognizes the role of policing practices in producing these disparities, citing reports that show Black people in the county are eight times more likely to be arrested than whites (this number is probably closer to eleven in the city of Madison). In response, they call for self-determination and an end to interactions with the police. In his patronizing response, Madison Police Chief Koval instead vows to increase police presence in neighborhoods of color, denying the role of policing practices in producing and/or upholding the city’s longstanding disparities. Similarly, Mayor Soglin has dismissed such critiques, saying racial bias in policing is “the wrong question to be asked,” instead deferring blame onto “the entire criminal justice system.”

With these divergent views on policing in mind, I began searching through police incident reports to see if they would reveal spatial or racial patterns of policing. I was particularly interested in revealing police patrol patterns to substantiate claims made by YGB and others that communities of color are over-policed. Patrol patterns are not made public by the city, but as others have observed, the presence of police in affluent Madison neighborhoods is minimal. To gather the data, I first keyword searched and then read police incident reports to determine incidents that happened while an officer was on patrol, not precipitated by a service call. I then searched court records to determine the race of those arrested (only cases that went to trial showed up on this search, which accounted for about 75% of incidents) and mapped the results. I found that arrests were clustered on the busy East Washington Avenue that traverses the isthmus, the bar and restaurant-filled State Street that connects campus with the Capitol building, and three communities in South Madison with high Black populations. I also found profound racial disparities in who was targeted and arrested in patrol stops, mirroring the findings in the Race to Equity report.

policeInMadison8

click to enlarge

Of course, there are limitations to this map. First, it is based on a limited amount of data, in large part because incident reports do not necessarily indicate when an officer was on patrol. Only through keyword searches and close readings was I able to build this database. Second, incidents only enter the city database if they are deemed to have “significant public interest.” The criteria for this categorization, as far as I am aware, is not made explicit by the city. Third, many incidents involved multiple people, which is not represented on this map. And last, I have not yet attempted to map the spatial distribution of the race of those involved, which may reveal other patterns. Despite these limitations, the map does reveal patterns that substantiate claims of uneven policing across the city.

Aug
24

The last year has found me fully immersed in the process of writing—a process that is constantly evolving as I experiment with new ways of thinking through words. I have been particularly interested in the ways that this blog might become part of that process. Beyond the more modest ambitions of opening a space to share work outside of academic paywall systems, encouraging me to develop a more regular writing practice, connecting with others in a more immediate way, and providing a place to assemble and test out ideas, I’m interested in the ways that blogging might push my thinking in new directions. Lauren Berlant, in reference to her blog Supervalent Thought, observes in an interview:

Supervalent Thought was an attempt for me to learn how to write, which is to say to learn better ways of mediating all the things I can bring to address a problem – in particular problems of seeing the subject constituted in non-sovereignty, in relationality, in the middle of the affective event. I think the practice of it has changed my writing a lot – one way I can tell this is that when I am writing I tend not to be blogging. I work on my entries, usually, for a long time. Because they really are thought by way of writing, and not just thought in writing, not just opinion.There was a little polemicism in the beginning, because I was writing during an intensively political season: but generally I see the blog entry as a staging area for feeling out the contours of a problem that was raised in an encounter. As for readers: I am really happy to be read, and occasionally the comment section induces interesting responses, but it’s also constrained, a little monologuish. I get lots of provocative email about entries, but I don’t write hoping to induce a response. I write hoping to move a problem somewhere, and in moving to open it up to different kinds of encounter with it, which changes its resonance and consequence and thereby its very structure.

Derek Gregory, who writes nearly everyday on his blog Geographical Imaginations, similarly reflects on his experience of blogging and its impact on his writing in a 2012 entry. In a more recent post, writing for a new book titled How We Write, blogging again is mentioned as an important part of his writing process.

And so begins this experiment in form, a public research notebook, really, which will contain and connect various issues in software, geography, politics, theory, visuality, and art, alongside the occasional bicycle.

~

For more discussions on academic blogging, see Sam Kinsley’s blog post “Being a Sharing Academic,” which links to a lot of good resources, including Anne Galloway’s dissertation chapter on blogging.