Archive for October, 2015

Oct
28

In the last week, I’ve come across several open access articles that might be of interest to geographers who engage with computers and software in their work. The first, written by James Ash, Rob Kitchin, and Agnieszka Leszczynski, begins with a nice summary of work in the discipline that has dealt with digital issues. The authors then argue that we shouldn’t have a separate field of “digital geography,” but, rather, we should think about how the digital has reshaped many of our objects of study. Here’s the abstract:

In this paper, we examine the relationship between the digital and geography. Our analysis provides an overview of the rich scholarship that has examined: (1) geographies of the digital, (2) geographies produced by the digital, and (3) geographies produced through the digital. Using this material we reflect on two questions: has there been a digital turn in geography? and, would it be productive to delimit ‘digital geography’ as a field of study within the discipline, as has recently occurred with the attempt to establish ‘digital anthropology’ and ‘digital sociology’? We argue that while there has been a digital turn across geographical sub-disciplines, the digital is now so pervasive in mediating the production of space and in producing geographic knowledge that it makes little sense to delimit digital geography as a distinct field. Instead, we believe it is more productive to think about how the digital reshapes many geographies.

You can download a copy on the Social Science Research Network page.

Also of interest is the new issue of Surveillance & Society–a double issue with a theme of “Surveillance Asymmetries and Ambiguities.” While I haven’t read it through yet, many of the abstracts sound very promising as scholars attempt to complicate understandings of power relations, especially in relation to computational surveillance practices.

Oct
27

hitachi viz suite

screenshot from video demo: https://www.youtube.com/watch?v=Xz_P9CXYpmA

Hitachi Data Systems, in a recent announcement, has upped the ante in the predictive policing game with the introduction of Visualization Predictive Crime Analytics (PCA) into their Visualization Suite. They claim:

PCA is the first tool of its kind to use real-time social media and Internet data feeds together with unique, sophisticated analytics to gather intelligent insight and enhance public safety through the delivery of highly accurate crime predictions.

The press release explicitly connects the technology to “smart cities,” claiming the suite will “help public and private entities accelerate extraction of rich, actionable insights from all of their data sources.” The use of the word “actionable” here is interesting and reminds me of Louise Amoore’s great article, “Data Derivatives: On the Emergence of a Security Risk Calculus for Our Times” from 2011. The data derivative, in Amoore’s articles, is the “flag, map or score” that is inferred from large data sets like those used in Hitachi’s PCA system. She argues:

The pre-emptive deployment of a data derivative does not seek to predict the future, as in systems of pattern recognition that track forward from past data, for example, because it is precisely indifferent to whether a particular event occurs or not. What matters instead is the capacity to act in the face of uncertainty, to render data actionable.

The whole project seems wildly ambitious, with unknown statistical models, machine learning algorithms, and natural language processing routines holding it all together. More from the press release:

Hitachi Visualization Suite (HVS) is a hybrid cloud-based platform that integrates disparate data and video assets from public safety systems—911 computer-aided dispatch, license plate readers, gunshot sensors, and so on—in real time and presents them geospatially. HVS provides law enforcement with critical insight to improve intelligence, enhance investigative capabilities and increase operational efficiencies. Along with capturing real-time event data from sensors, HVS now offers the ability to provide geospatial visualizations for historical crime data in several forms, including heat maps. This feature is available in the Hitachi Visualization Predictive Crime Analytics (PCA) add-on module of the new Hitachi Visualization Suite 4.5 software release.

Blending real-time event data captured from public safety systems and sensors with historical and contextual crime data from record management systems, social media and other sources, PCA’s powerful spatial and temporal prediction algorithms help law enforcement and first responder teams assign threat levels for every city block. The algorithms can also be used to create threat level predictions to accurately forecast where crimes are likely to occur or additional resources are likely to be needed. PCA is unique in that it provides users with a better understanding of the underlying risk factors that generate or mitigate crime. It is the first predictive policing tool that uses natural language processing for topic intensity modeling using social media networks together with other public and private data feeds in real time to deliver highly accurate crime predictions.

hitachi infographic

from: https://www.hds.com/assets/pdf/hitachi-social-innovation-and-visualization-solutions-infographic.pdf

Oct
12

On Thursday at 10:30am, I will be talking about maps and art at the Annual Meeting of the North American Cartographic Information Society (NACIS). My abstract read:

Remapping Spatial Sensibilities
In a number of recent articles, scholars have drawn connections between cartography and the visual arts. These connections are usually confined to questions of aesthetics and representation, eschewing larger conceptual and historical connections. In this paper, I deploy Jacques Rancière’s concept of the “distribution of the sensible,” which he uses to describe how art changes what we are able to perceive. Using a number of maps as examples, I use this concept to trace a history of cartography concerned with changing understandings of space. This periodization, I argue, suggests a path forward for cartographic work concerned with developing new spatial cognizance, or using Rancière’s terms, re-distributing what is spatially sensible. This path, informed by art theory, opens up exciting new possibilities for cartographic work to exist as an independent knowledge-producing practice, intersect with theories in human geography, respond to the current moment, and produce new representations of space.

The conference schedule looks excellent and people keep telling me good things about past meetings, so I’m excited to be participating.

Oct
5

PH97214-b

PredPol software used in Santa Cruz, CA

Recently, I’ve been writing about software used in surveillance and policing practices. One such practice, called predictive policing, uses software packages to analyze spatial crime data and predict where and when future crimes are likely to happen. Police departments can then use this information to decide where to deploy officers. This practice has received some mainstream press in recent years, with many pointing out its similarities with the Pre-crime division in the 2002 film Minority Report. Coincidently, the last three cities I’ve called home–Santa Cruz, Oakland, and Madison–have all used predictive policing software.

One popular package, PredPol, use principles from earthquake aftershock modeling software. Others are sometimes compared to analytic software used to create targeted ads through the analysis of customer shopping data. Of course, these software packages are proprietary, making it difficult to look under the hood to see how they really work. But their use of existing crime data should be a cause for alarm, especially in places with disparities in policing.

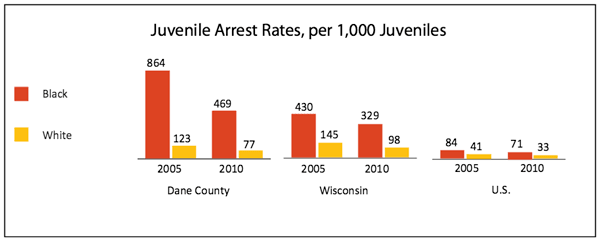
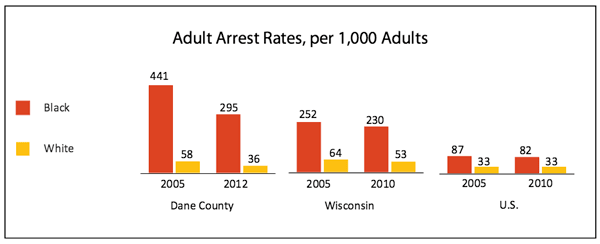
A news article from the Wisconsin State journal last year indicates that crime analysts in Madison are using predictive policing software, although the details are vague and there isn’t much documentation that I could dig up. But in a city with well-documented and profound racial disparities in policing, we can only guess that this will reinforce those practices.

As Ingrid Burrington writes in a Nation article:

All of these applications assume the credibility of the underlying crime data—and the policing methods that generate that data in the first place. As countless scandals over quotas in police departments demonstrate, that is a huge assumption.

She observes:

It’s easy to imagine how biased data could render the criminal-justice system even more of a black box for due process, replacing racist cops with racist algorithms.

The adoption of software solutions for policing, whether implicitly or explicitly, often contain the hope of bypassing the problem of structural racism in policing. But these software packages can only reinforce those racist assumptions if they rely on datasets constructed through policing practices. Madison Police Chief Koval rejects claims that his department is responsible for racial disparities in policing, deferring blame onto the larger community:

“On any given month, more than 98 percent of our calls for service are activated through the 9-1-1 Center,” he said in a statement. “Upon arrival, our officers are required by law to evaluate the behavior that is manifesting to see if it reaches legal thresholds required to ticket and/or arrest.”

But, as I argued in an earlier post, the practices of patrolling officers seem to reflect those same disparities (although, the role of community members in perpetuating racism should also be taken seriously). This can only lead to a situation where the algorithms merely reflect and hone actually existing ideas and spatial imaginaries about who commits crimes and where. And I don’t doubt that these systems will produce arrest statistics to back up their claims, but whose interests are they serving?

As Ellen Huet observes in Forbes:

Police departments pay around $10,000 to $150,000 a year to gain access to these red boxes, having heard that other departments that do so have seen double-digit drops in crime. It’s impossible to know if PredPol prevents crime, since crime rates fluctuate, or to know the details of the software’s black-box algorithm, but budget-strapped police chiefs don’t care. Santa Cruz saw burglaries drop by 11% and robberies by 27% in the first year of using the software. “I’m not really concerned about the formulas,” said Atlanta Police Chief George Turner, who implemented the software in July 2013. “That’s not my business. My business is to fight crime in my city.”

I think it’s time to be concerned.